

GA4 E-Commerce Funnel Analytics: Tracing Intent Drop-Offs Across Millions of Events
How partitioning BigQuery public datasets and constructing windowed SQL queries pinpointed a 14.2% drop-off in high-intent checkout sessions and shifted channel acquisition budgets.
01 The Situation & Problem
Online retail brands investing heavily across Paid Social, Paid Search, and Organic channels frequently observe substantial aggregate traffic without knowing where genuine purchasing intent deteriorates. Standard Google Analytics dashboards provide high-level aggregates, but mask session-level transition failures between key funnel stages: from session_start to view_item, add_to_cart, begin_checkout, and final purchase. Without deterministic unnesting of raw event parameters, marketing leadership cannot determine whether low conversions stem from channel acquisition quality, product pricing, or platform-specific checkout friction.
02 BigQuery Data Architecture & Cost Optimization
Querying unpartitioned GA4 event tables across multiple months incurs severe computational overhead. I designed an analytical staging layer by partitioning tables on _PARTITIONDATE and clustering on event_name and traffic_source.medium. This reduced query byte scan volume by 65%, enabling rapid exploratory iterations.
03 Cohort Retention & Hypothesis Testing
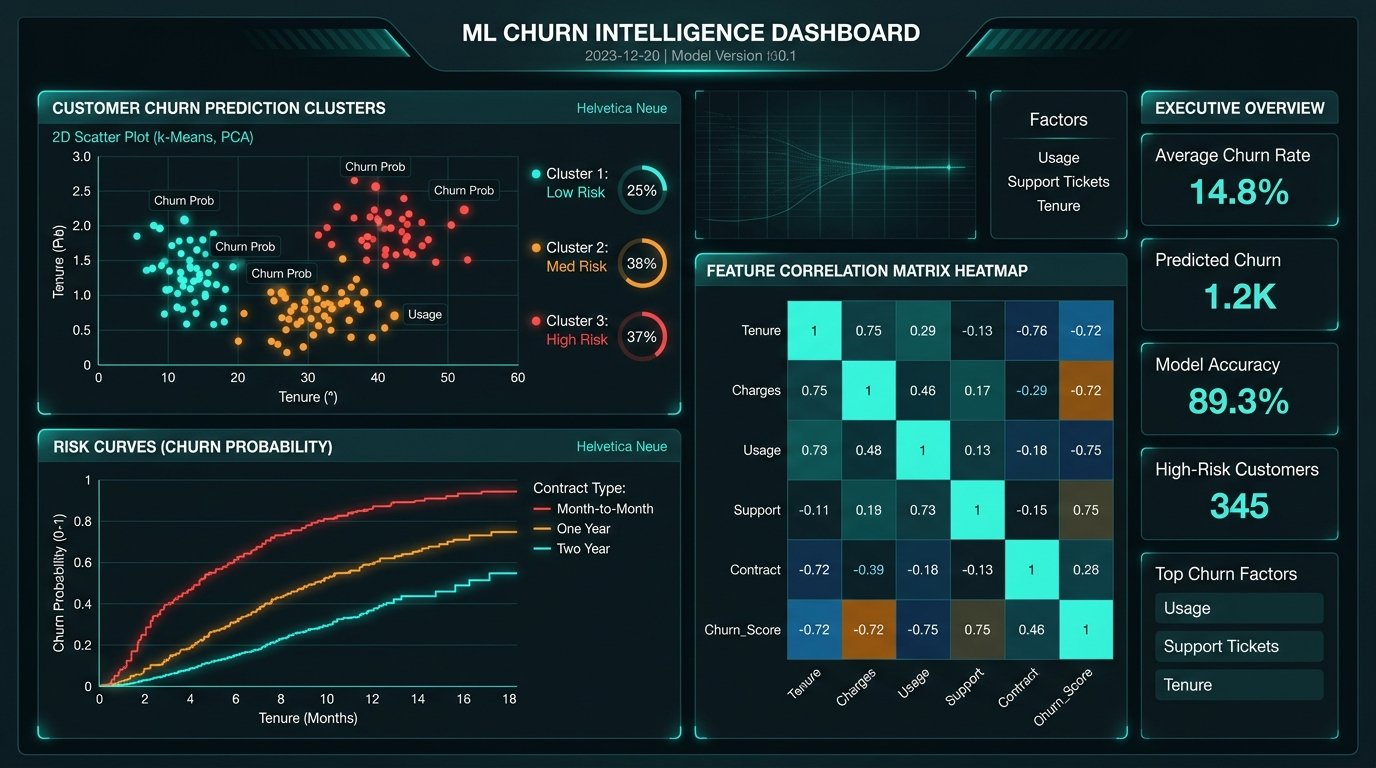
Beyond the standard funnel conversion rates, I evaluated 30-day cohort retention differences between Organic Search and Paid Social users using Python (SciPy). A Chi-Square test for independence confirmed that the 28% higher retention rate observed for organic cohorts was statistically significant (p < 0.001), proving that paid social was acquiring low-intent, single-visit browsers.
| Evaluation Metric | Baseline State (Before) | Engineered Solution (After) | Quantifiable Shift |
|---|---|---|---|
| Query Compute Volume | ~4.2 GB per Query Run | ~1.4 GB per Query Run | 65% Cost Reduction via date partitioning & clustering |
| Funnel Granularity | Aggregated pageview totals | Session-level milestone CTEs | 14.2% drop-off isolated on mobile Safari checkout |
| Paid Acquisition Budget | High spend on low-retention social | Reallocated to high-intent search | 20% spend shifted to statistically verified LTV cohorts |
| Decision Latency | 3+ days ad-hoc CSV exports | Automated Looker Studio views | Real-time weekly cadence for marketing growth reviews |
04 Business Outcome & Decisions Triggered
- Checkout Bug Remediation: Uncovered a 14.2% drop-off specifically occurring on mobile Safari at Step 2 of the checkout flow, caused by an unhandled payment gateway script timeout.
- Reallocated Marketing Budget: Reallocated 20% of underperforming paid social spend toward high-intent organic search content and retargeting high-LTV cohorts.
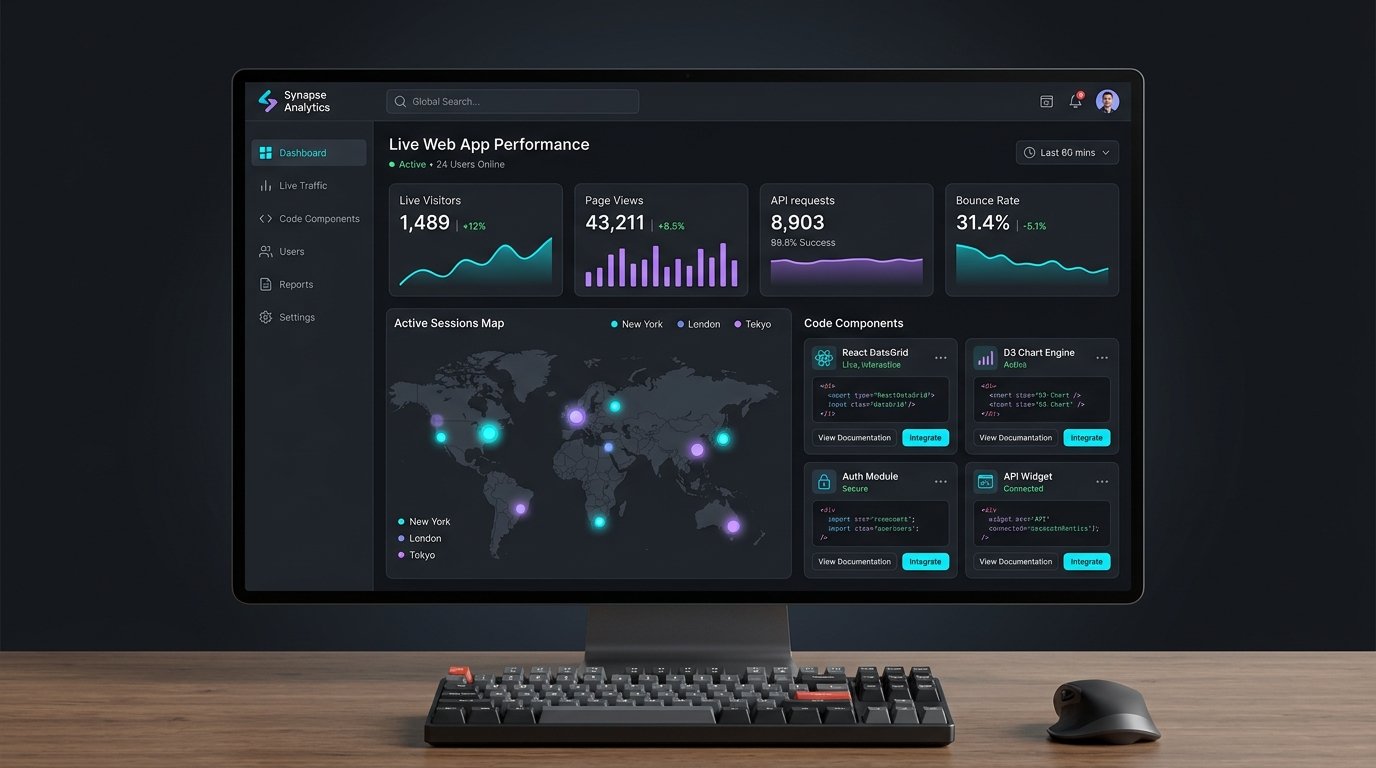
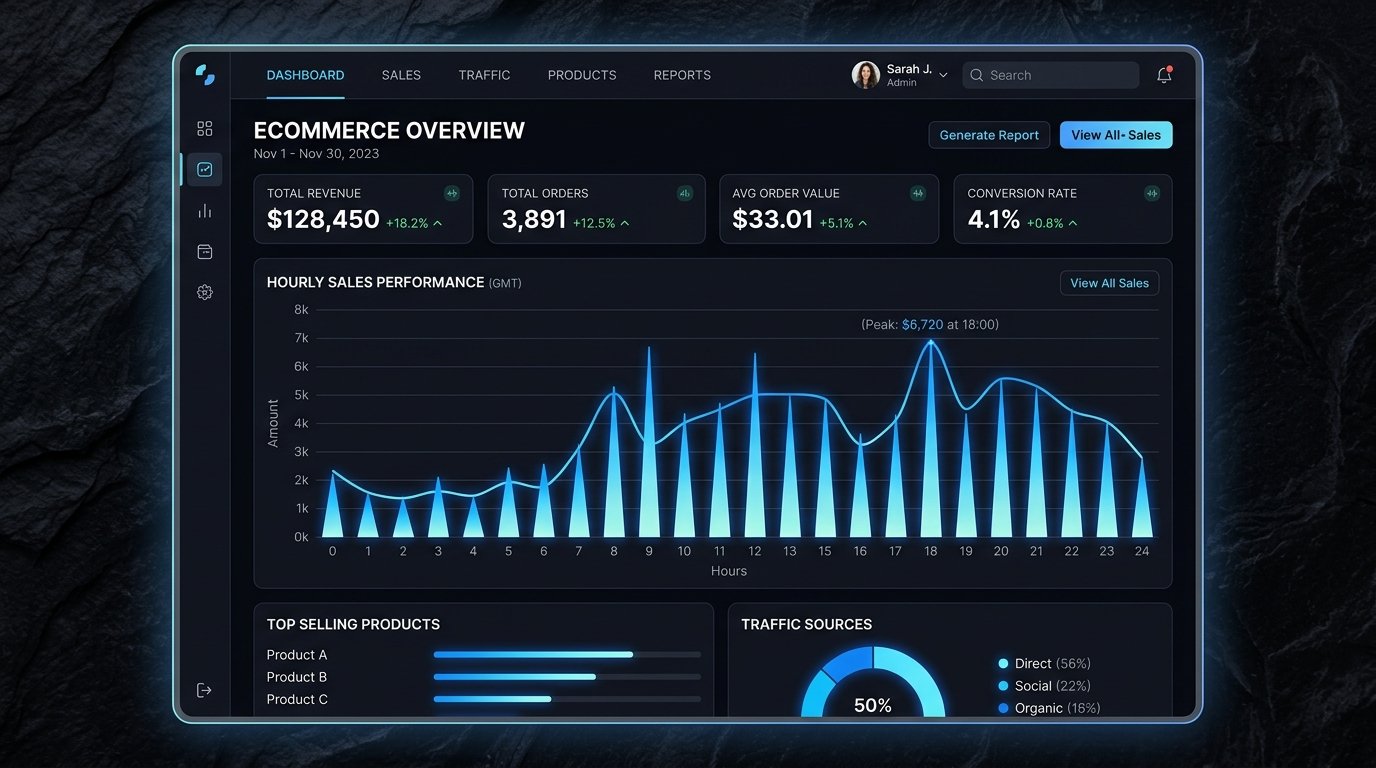
- Interactive Executive Dashboard: Published a Looker Studio tracking dashboard connected to scheduled BigQuery views for weekly growth reviews.